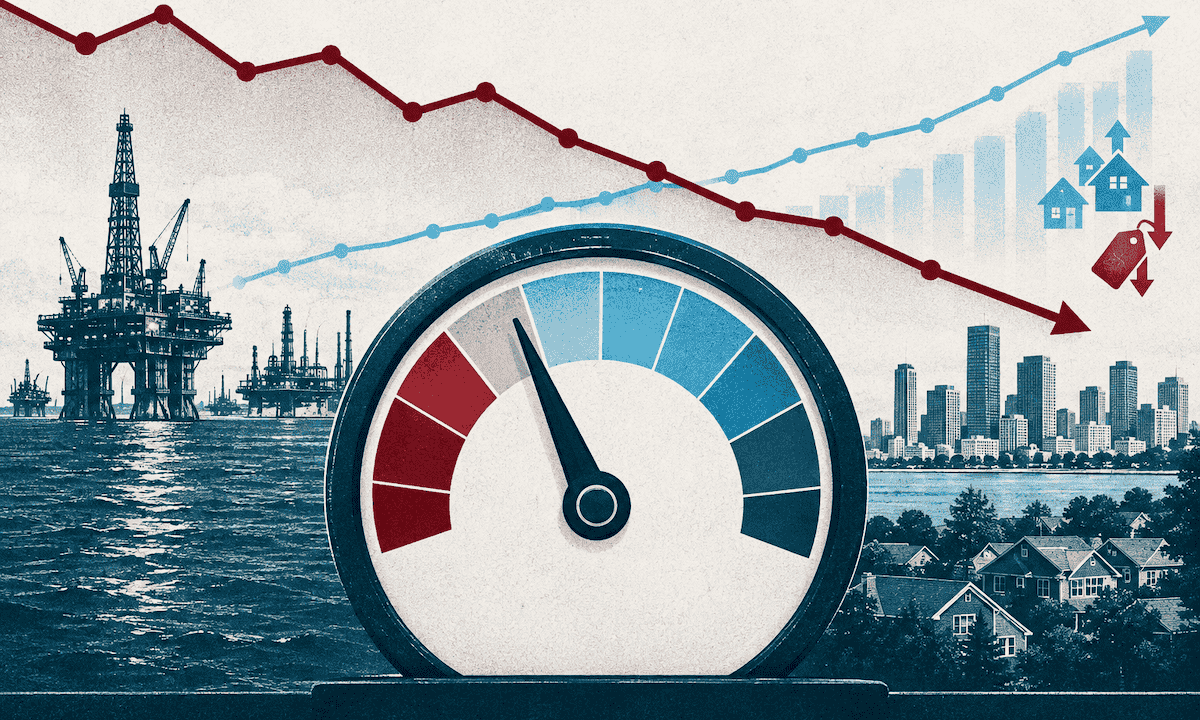
The relentless downward pressure on housing demand finally showed signs of stabilization last week, as a slight retreat in mortgage rates provided a much-needed reprieve for prospective buyers. After witnessing mortgage rates climb toward a peak of 7.60%, the market experienced a shift as rates drifted back toward 7.30%. This moderation, occurring during one of the most volatile weeks for the bond market in 2026, brought a temporary halt to the consistent "bleeding" of demand that has characterized recent months. As the industry turns its attention to the final week of October, stakeholders are closely evaluating the interplay between the 10-year yield, mortgage rate fluctuations, and broader economic indicators to determine what the remainder of the year may hold for the housing sector.
10-Year Yield and Mortgage Rate Dynamics
The bond market has been defined by a period of extreme turbulence, keeping investors and housing analysts on high alert. The narrative throughout October has centered heavily on the 10-year yield’s ability to maintain a critical threshold of 5.35%. Even in the face of headwinds—including elevated global oil prices and firm economic data that typically exert upward pressure on yields—this key technical level has held firm.
Combined with emerging signs of weakness within the artificial intelligence sector, which shifted market sentiment, the 10-year yield managed to dip back below the 5% mark last week. This development was crucial for the housing market, as it pushed mortgage rates slightly lower from their recent highs. For market observers who had grown increasingly concerned about the potential for mortgage rates to accelerate toward 8% or even 9%, this recent stability is a welcome development. The current consensus among analysts is that as long as the 10-year yield remains anchored below that 5.35% ceiling, and provided that geopolitical tensions do not further inflame oil markets, the worst-case scenarios for borrowing costs remain off the table for the immediate future.
Evaluating Mortgage Spreads
While mortgage rates have retreated slightly, the underlying health of mortgage spreads remains a primary concern for the industry. Since the lows observed earlier in the year, spreads have widened, though they continue to track near the cycle lows established when the Federal Reserve initiated its rate-hike campaign in 2022.
The importance of these spreads cannot be overstated; for the mortgage market to function optimally, analysts prefer to see spreads closer to the 2% range rather than approaching 3%. It is important to note, however, that when the 10-year yield experiences sharp downward movements, spreads often widen as a technical reaction to limit volatility. Consequently, the recent expansion of these spreads to 2.23%—up slightly from 2.21% the prior week—is a logical response to the shifting bond market environment. Historically, these spreads have occupied a range between 1.60% and 1.80%, and their current positioning reflects the ongoing search for equilibrium in a high-rate environment.
Weekly Pending Sales and Demand Trends
The latest data on pending home sales offers a week-to-week snapshot of consumer sentiment, though analysts caution against reading too much into short-term fluctuations caused by seasonal factors or holiday timing. Typically, pending sales data serves as a leading indicator, taking roughly 30 to 60 days to fully manifest in closed sales figures.
Last week, the data provided a rare moment of relief: the consistent decline in pending sales finally stopped, resulting in a slight positive print. While this is a constructive sign, it is perhaps too early to declare a definitive turnaround. The recent softening of the market had been occurring at a rapid pace, and in such an environment, it does not take a significant change in rates to momentarily halt that decline.
Historically, housing demand has demonstrated robust growth when mortgage rates remain below the 6.64% threshold. In the first half of 2026, the only major interruptions to this demand were external factors like severe weather or holiday lulls. However, the data from the past three years and ten months consistently shows that once rates surpass the 7% mark, market activity invariably cools. The challenge for the remainder of the year will be whether rates can return to levels that stimulate, rather than suppress, buyer participation.
Purchase Applications and Long-Term Outlook
Looking further ahead, purchase application data serves as a vital signal for the market’s direction over the next 30 to 90 days. As mortgage rates breached the 6.64% level and climbed above 7%, purchase applications began to soften noticeably.
Because the most recent data does not fully account for the slight rate relief observed in the final days of the week, analysts are waiting to see if next week’s figures will show a rebound in application volume. Currently, the damage caused by the high-rate environment is evident, with purchase applications recording declines both on a week-to-week basis and compared to the same period last year. The industry remains in a "wait-and-see" mode, monitoring whether the recent, marginal decrease in rates is sufficient to draw buyers back into the fold.
Housing Inventory and New Listings
Housing inventory growth has remained uncharacteristically tame throughout 2026, with some weeks even showing year-over-year declines. However, the inverse relationship between mortgage rates and inventory continues to hold: when rates rise, particularly above the 7% threshold, inventory tends to accumulate more rapidly as the pool of active buyers shrinks.
Growth in inventory has been slower than in previous years, largely because the market has moved closer to a baseline of "normal" levels. Since mid-August, however, the pace of inventory growth has accelerated. Year-over-year comparisons are also becoming easier to beat, given that mortgage rates were significantly lower during the same period last year, a time when demand was surging toward a nine-month high. Currently, inventory growth is tracking at approximately 5.68%.
New listings are following their typical seasonal decline, yet 2026 remains the healthiest year for new listings since 2022, with volume reaching over 80,000 at several points this year. A lingering concern for market participants is the "lock-in" effect; because most home sellers are also prospective homebuyers, high rates can deter homeowners from listing their properties. Should this hesitation grow, it could lead to a broader trend of declining new listings. While current levels remain healthy compared to recent years, they remain far below the historical norms of the housing bubble era, when new listings routinely ranged from 250,000 to 400,000 per week.
Price-Cut Percentages and Market Valuations
The prevalence of price reductions is a key metric for understanding the flexibility of sellers in a changing market. Typically, about one-third of homes undergo a price adjustment before closing. Throughout most of 2026, the percentage of homes with price cuts remained lower than in the previous year. This trend shifted, however, as mortgage rates moved above 6.64% and eventually 7%. With demand softening, the share of homes seeing price cuts has risen by approximately 1% year-over-year.
Despite these shifts, home-price growth remains remarkably resilient. Earlier this year, forecasts anticipated a national decline of roughly 0.62% for 2026. However, as home-price indexes continue to show growth in the 1% to 2% range, achieving that projected decline appears increasingly difficult. The market is proving more stubborn than many analysts expected, with prices failing to make significant downward moves despite the cooling in transaction volume.
The Week Ahead: Geopolitics and Policy
As October draws to a close, the market remains focused on a convergence of volatile variables. Global oil prices are sitting at yearly highs, a factor that continues to weigh heavily on the inflation outlook and, by extension, interest rates. Geopolitical tensions, particularly regarding Iran, remain a point of uncertainty, as the potential for further price volatility in the energy sector remains high. Additionally, analysts are watching international trade dynamics and their potential to influence commodity prices as the midterm election cycle approaches.
Simultaneously, the performance of the AI sector and its impact on high-yield credit spreads will be closely monitored; any significant widening of these spreads could signal difficulty in funding future technological projects, adding another layer of risk to the broader economy. Finally, the upcoming Federal Reserve meeting is expected to provide critical guidance. The primary objective for the month has been to ensure the 10-year yield does not sustain a position above 5.35%, avoiding a broader escalation of market instability. If the market can maintain this level, the industry will consider the outcome a successful navigation of a highly precarious month.